Key Takeaways
- In Tennessee, we’re living at 90.7% of our optimal health, slightly lower than the national average of 91.5%
- The health conditions having the greatest impact on the health of Tennesseans are: hypertension, major depression, coronary artery disease, high cholesterol and diabetes (type II)
- At BlueCross, we embrace our role in using our data insights to create positive change on behalf of our neighbors in Tennessee.
BlueCross is committed to improving the health of the members and communities we serve. And the data gathered through these interactions helps us better inform strategies for those efforts. The health conditions that affect us here in Tennessee are the same issues that affect all Americans: high blood pressure, depression, heart disease and diabetes. These issues impact our health every day, affecting how long we live and, most importantly, our quality of life.
Given the magnitude of these issues, they are true public health challenges. And we embrace our role in using our data insights to create positive change on behalf of our neighbors in Tennessee.
BlueCross BlueShield (BCBS) Health Index
The BCBS Health Index uses 200 health conditions to identify which ones affect us most. It’s powered by data from 41 million members and is often used in discussions about how to improve health, policy and practice.
The index assigns populations a score between 0 and 100, where 100 represents optimal health based on potential lifespan.
- The higher the score, the closer a population is to achieving optimal health
- The lower the score, the more a population has been adversely impacted by certain health conditions
Where does Tennessee fall on the BCBS Health Index relative to the rest of the country?
- In the U.S., we’re living at 91.5% of our optimal health
- In Tennessee, we’re slightly lower, living at 90.7%
According to the BCBS Health Index, the healthiest states are:
- California and Colorado (93.6)
- Utah and Montana (93.5)
- Idaho and South Dakota (93.4)
The least healthy states are:
- West Virginia (89.8)
- Maryland (89.3)
- Florida (88.9)
- Rhode Island (88.6)
- Alabama (88.1)
Tennessee lands in the middle/on the less healthy side alongside states such as Maine, Massachusetts, Mississippi and Arkansas.
The top health conditions that affect health in Tennessee

While these are the same health conditions that affect the U.S. as a whole, Tennessee sees slightly higher rates of COPD and slightly lower rates of alcohol use disorder.
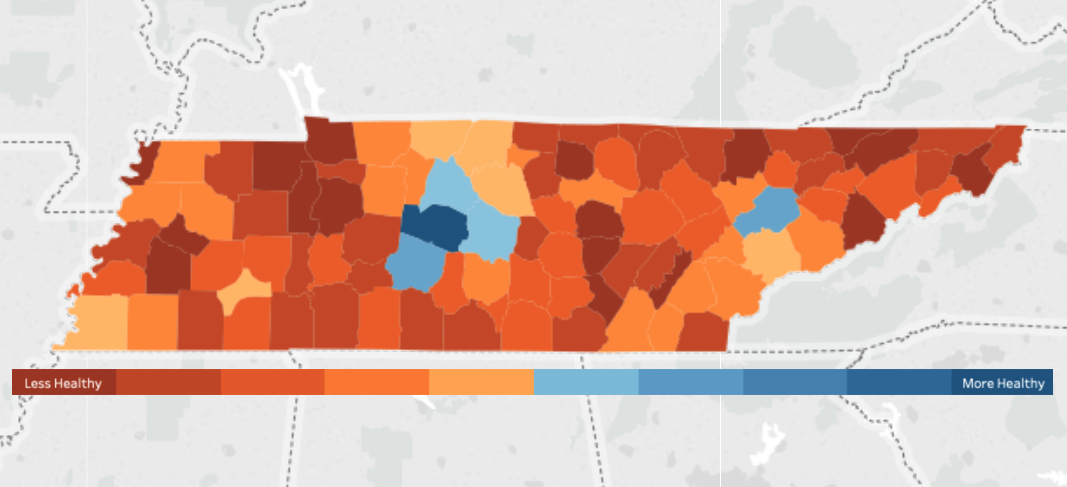
County health rankings
Broken down by county, these health rankings paint a clearer picture of where Tennesseans are living closest to optimal health and where we still face challenges.
Here are the 5 counties where we are living closest to our optimal health:

Williamson — 93.1
Lauderdale — 91.9
Warren — 91.5
McNairy — 91.4
Cumberland — 91.4
Here are the 6 counties where we are living furthest from our optimal health:

Benton — 87.4
Cocke — 87.4
Campbell — 88.1
Jackson — 88.3
Rhea — 88.3
Stewart — 88.3
Scroll through the list below to see where your county ranks, and click here to learn more about health in your county.
| County | Score |
|---|---|
| Williamson | 93.1 |
| Maury | 91.9 |
| Knox | 91.5 |
| Davidson | 91.4 |
| Rutherford | 91.4 |
| Chester | 91.2 |
| Sumner | 91.2 |
| Wilson | 91 |
| McMinn | 90.9 |
| Gibson | 90.9 |
| Obion | 90.9 |
| Shelby | 90.9 |
| Robertson | 90.8 |
| Montgomery | 90.8 |
| Bradley | 90.7 |
| Grundy | 90.7 |
| Weakley | 90.7 |
| Blount | 90.6 |
| Pickett | 90.6 |
| Fayette | 90.6 |
| Dekalb | 90.5 |
| Dickson | 90.5 |
| Lewis | 90.5 |
| Bedford | 90.4 |
| Dyer | 90.4 |
| Franklin | 90.4 |
| Marshall | 90.4 |
| McNairy | 90.4 |
| Hamilton | 90.4 |
| Loudon | 90.4 |
| Overton | 90.4 |
| Bledsoe | 90.3 |
| Henderson | 90.3 |
| Madison | 90.3 |
| Sevier | 90.3 |
| Trousdale | 90.3 |
| Anderson | 90.2 |
| Cheatham | 90.2 |
| Coffee | 90.2 |
| Houston | 90.2 |
| Moore | 90.2 |
| Tipton | 90.2 |
| Putnam | 90.2 |
| Union | 90.2 |
| Cumberland | 90.1 |
| Decatur | 90.1 |
| Monroe | 90.1 |
| Warren | 90.1 |
| Hardeman | 90 |
| Macon | 90 |
| Smith | 90 |
| Clay | 89.9 |
| Hickman | 89.9 |
| Carroll | 89.8 |
| Greene | 89.8 |
| Jefferson | 89.8 |
| Johnson | 89.8 |
| Lawrence | 89.8 |
| Humphreys | 89.6 |
| Sullivan | 89.6 |
| Washington | 89.6 |
| Hamblen | 89.5 |
| Giles | 89.5 |
| Lincoln | 89.5 |
| Polk | 89.5 |
| Crockett | 89.4 |
| Hardin | 89.4 |
| Morgan | 89.4 |
| Wayne | 89.4 |
| Cannon | 89.3 |
| Henry | 89.3 |
| Roane | 89.3 |
| Sequatchie | 89.2 |
| Unicoi | 89.2 |
| Claiborne | 89.1 |
| Scott | 89.1 |
| White | 89 |
| Haywood | 88.9 |
| Lauderdale | 88.9 |
| Meigs | 88.9 |
| Fentress | 88.8 |
| Hawkins | 88.8 |
| Lake | 88.8 |
| Van Buren | 88.8 |
| Hancock | 88 |
| Carter | 88.7 |
| Grainger | 88.7 |
| Marion | 88.7 |
| Perry | 88.7 |
| Jackson | 88.3 |
| Rhea | 88.3 |
| Stewart | 88.3 |
| Campbell | 88.1 |
| Benton | 87.4 |
| Cocke | 87.4 |